2017 Ends With S&P 500 Total Return Of 21.8%
Published Friday, December 29, 2017 at: 7:00 AM EST
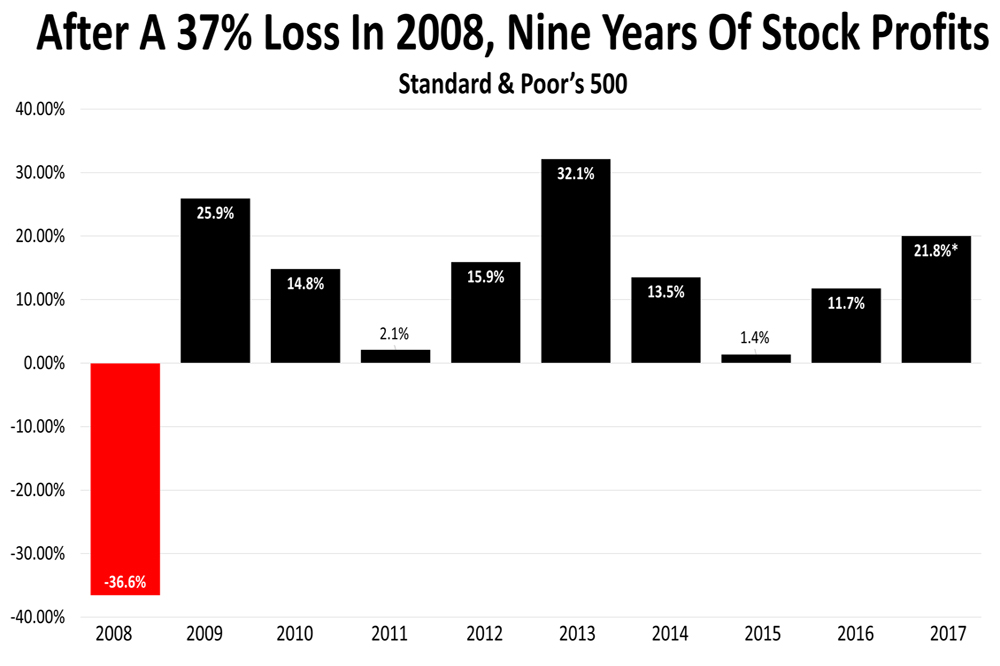
Shares in America's largest publicly-held companies closed 2017 with about a 21.8% total return.
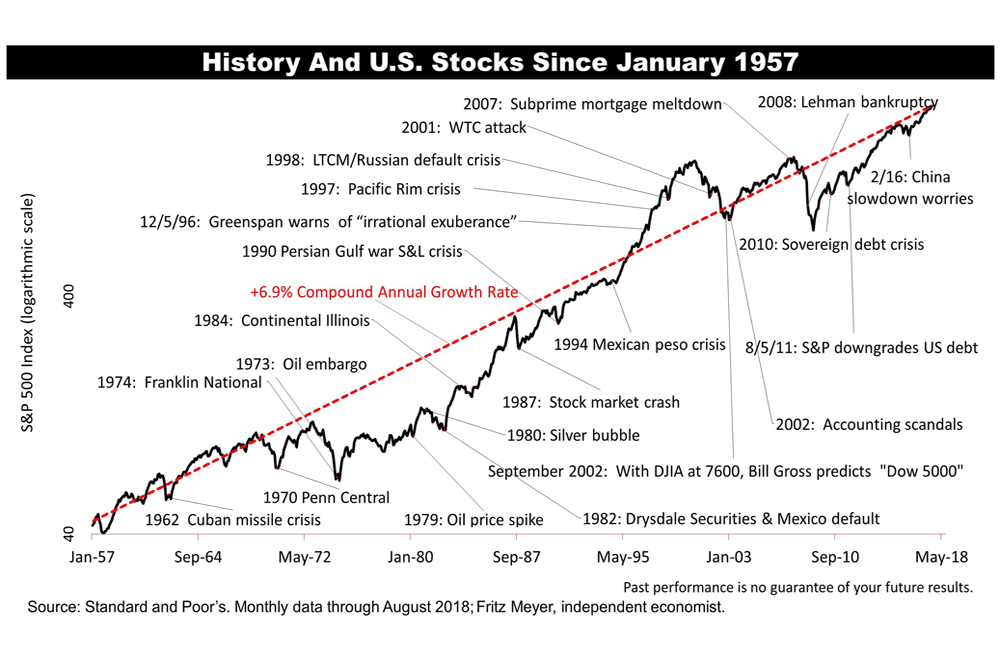
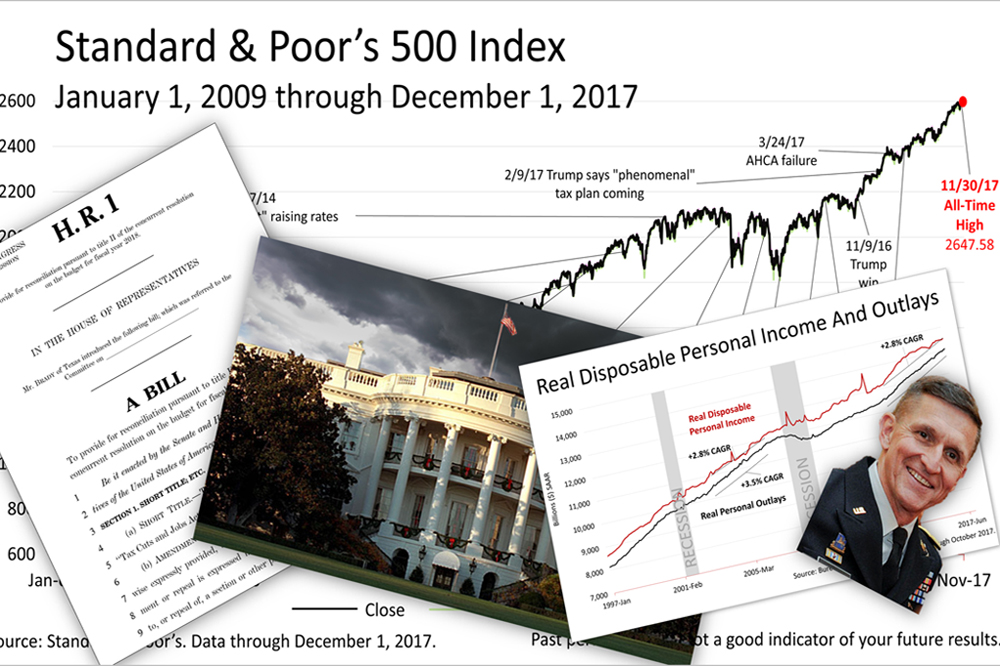
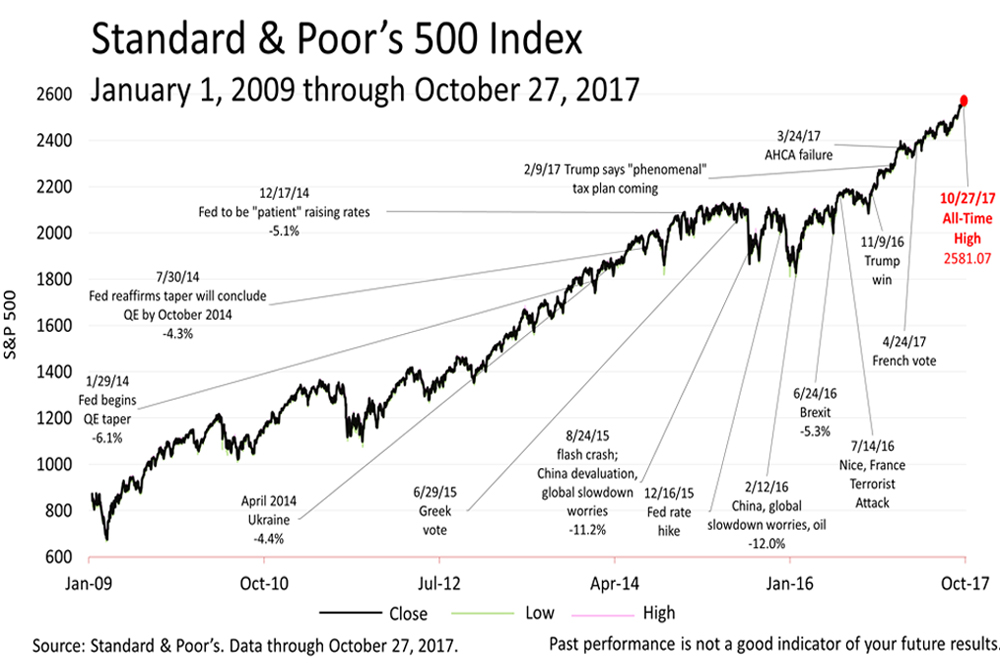
Since the financial crisis bear market of 2008, when the Standard & Poor's 500 index lost 36.6%, the stock market has returned a profit for nine straight calendar years.
It marked the 32nd time in the 90 calendar-years since the inception of the modern era of Wall Street trading that stocks returned more than 20% in a calendar year.
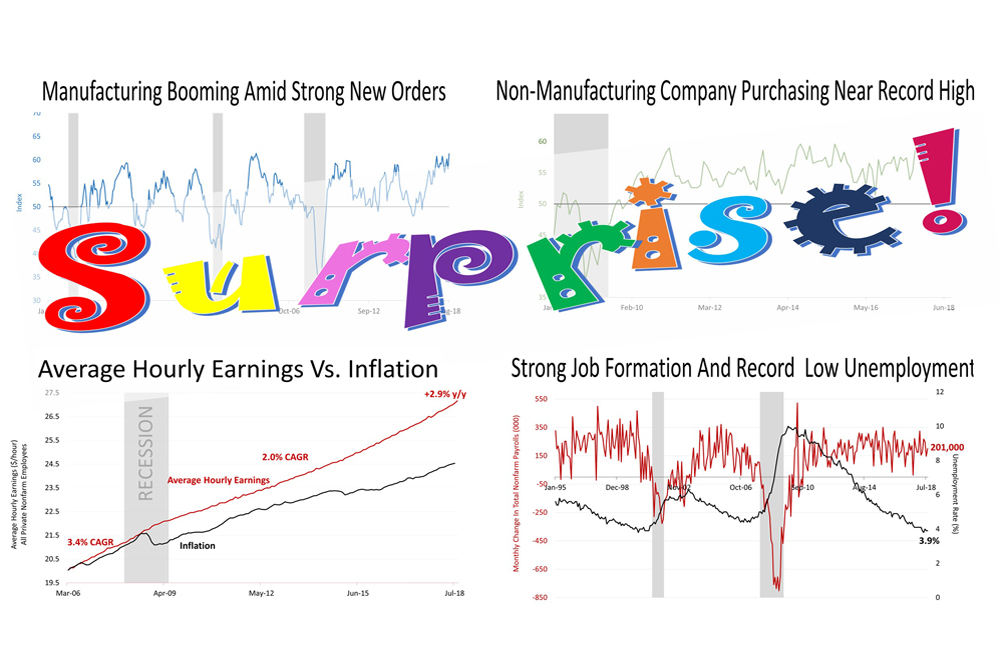
Stock prices broke new record highs month after month in 2017 as the economy repeatedly surprised Wall Street. Citigroup's economic surprise index, which tracks how often and how much economists are surprised - positively and negatively - by the release of economic data soared in the last quarter, after hovering in recent weeks in record high territory not seen since 2011.
A Wall Street Journal article on December 27 warned that good economic surprises must eventually come to an end. "Better data typically cause economists to lift their forecasts," The Journal's Ben Eisen wrote. "Eventually, the expectations get high enough that the data can't stay ahead of what economists are predicting. When data start missing expectations, the index turns negative."
The S&P 500 dropped one-half of 1% Friday to end the year at 2673.61. Of course, no one can know for sure what is in store for 2018.
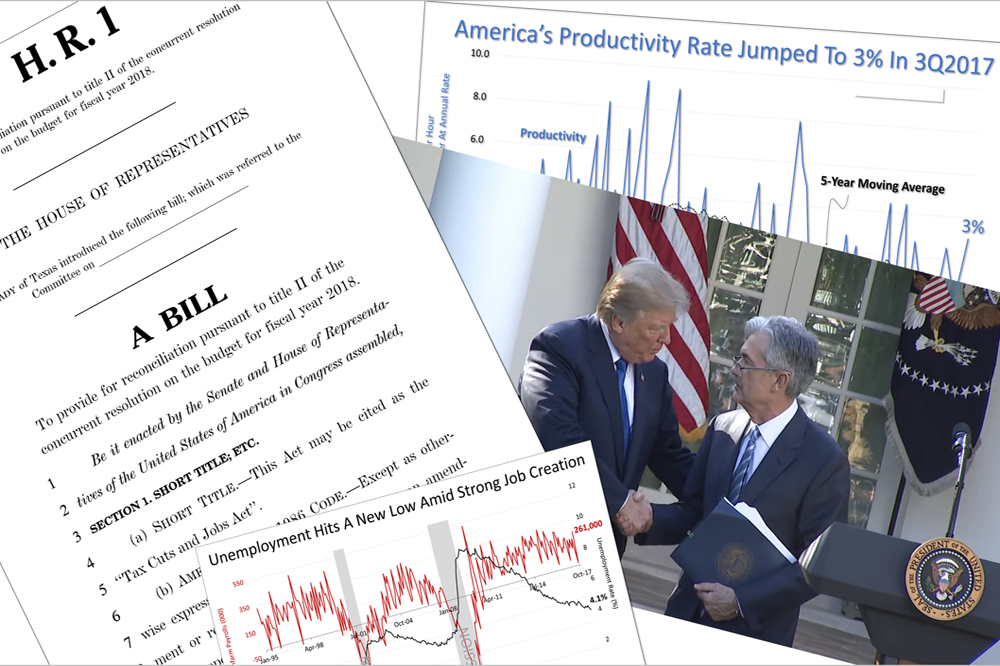
Tax reform could accelerate economic growth and cause the Federal Reserve to make a policy mistake - quashing growth or allowing the economy to overheat and inflation to surge. Washington, in the midst of a major political scandal and the nuclear standoff with North Korea could explode in an instant with terrifying consequences. There is plenty to worry about, as always.
A 10% or 15% drop could occur at any time on bad news and the chance of a bear market decline of 20% or more increases as the eight-and-a-half-year bull market grows older.
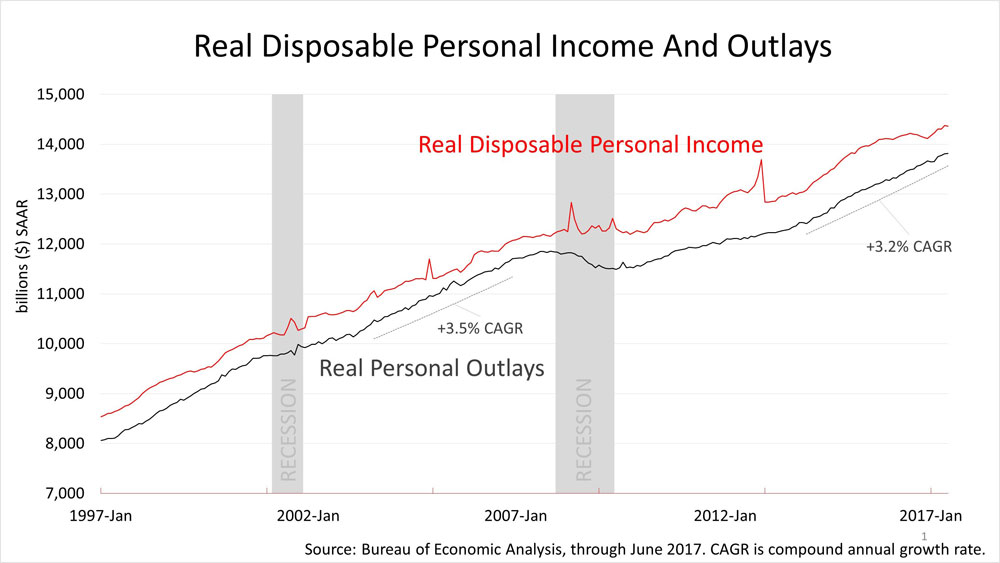
However, disposable personal income, after accounting for inflation, rose 2.8% in the 12 months through the end of November, and retail sales are booming. This is a key driver of the U.S., which derives 70% of its growth from consumers.
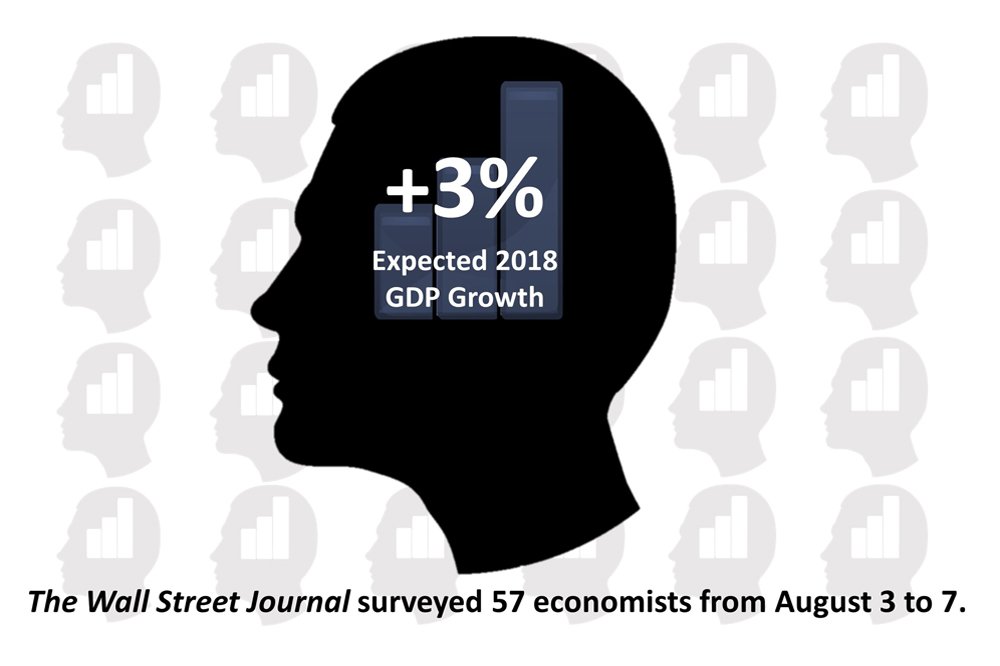
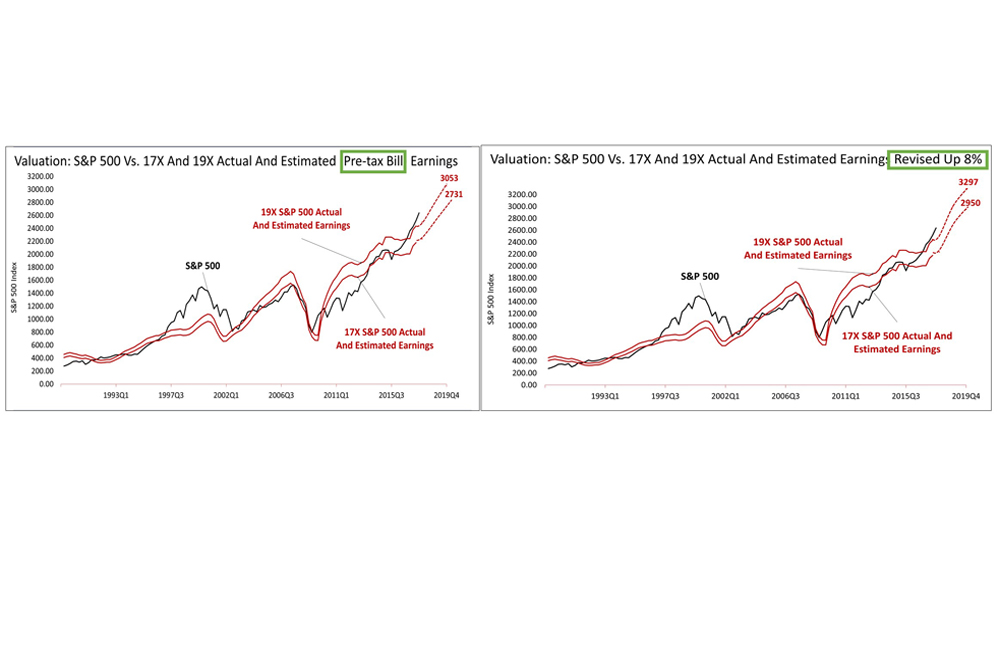
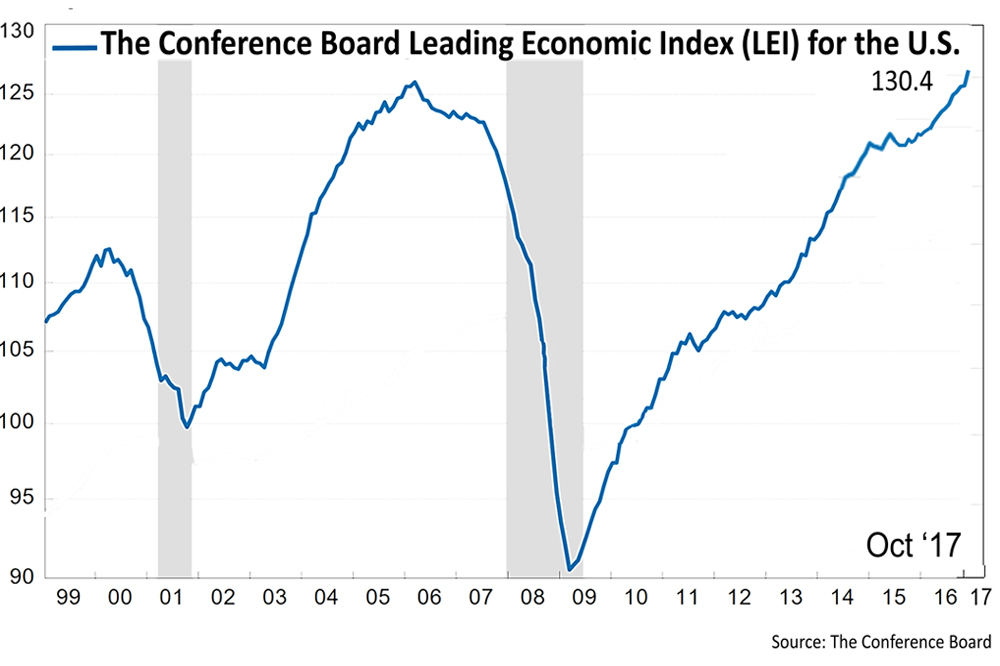
Leading economic indicators are signaling strength is ahead in 2018, the Federal Reserve's forecast is bright, the world economy is growing in synchronicity with the U.S for the first time in many years, and the new tax law is expected to bump earnings estimates higher by about 8%.
The bull market could continue in 2018, possibly for a long time, and it could head higher still. It remains the key component of growth in a broadly diversified portfolio.
2017 (estimated), 2018 (estimated) and 2019 (estimated) bottom-up S&P 500 operating earnings per share as of December 4, 2017: for 2017(e), $131.45; for 2018(e), $157.89; for 2019(e), $173.55. Sources: Yardeni Research, Inc. and Thomson Reuters I/B/E/S for actual and estimated operating earnings from 2015. Standard and Poor's for index prices through December 4, 2017 and actual operating earnings data through 2014.
This article was written by a veteran financial journalist based on data compiled and analyzed by independent economist, Fritz Meyer. While these are sources we believe to be reliable, the information is not intended to be used as financial advice without consulting a professional about your personal situation.
Indices are unmanaged and not available for direct investment. Investments with higher return potential carry greater risk for loss. Past performance is not an indicator of your future results.
2024
-
 Stocks Closed At A Record High
-
 Federal Reserve Projects Strong Growth
-
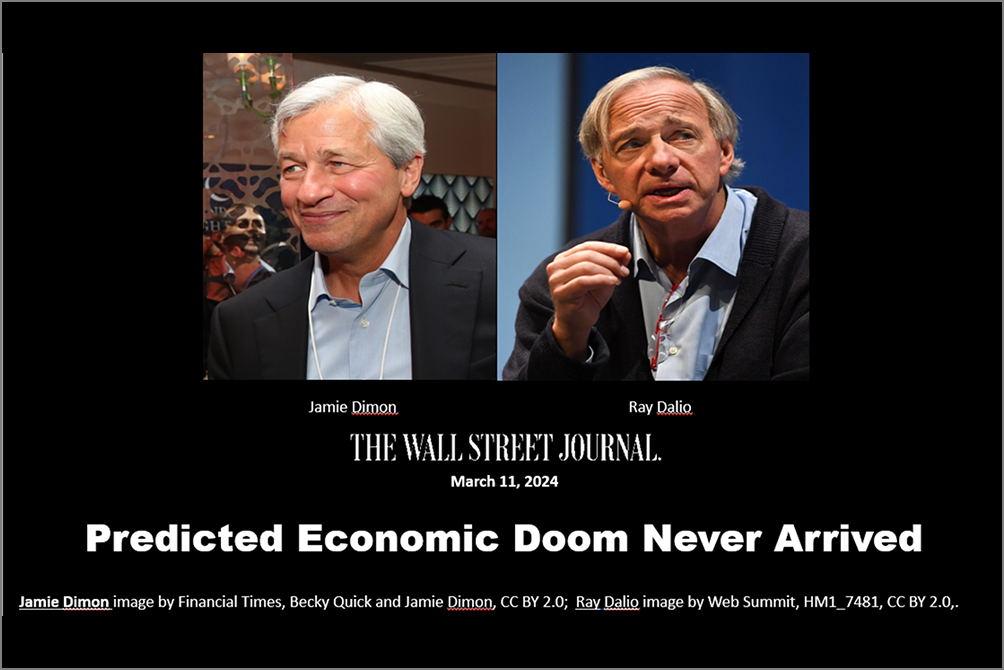 The Best People Were Wrong
-
 This Week’s Investment News In Six Charts
-
 U.S. Investor Picture Of The Week
-
 The Conference Board Backs Off Its Recession Forecast
-
 Softening Economic Data, Inflation Fears Dampen Stock Rally
-
 S&P 500 Closes Above 5000 For The First Time Ever
-
 Why America Is The World’s Economic Leader
-
 Investment News For The Week Ended Friday, January 26
-
 Why Stocks Broke The All-Time Record High
-
 A Strategic Update, With Stocks Near All-Time High And Crises Unfolding





























.png)